Grafana
Grafana is an open-source web platform for interactive, real-time analytics and data visualization. It integrates with a wide range of data sources, including Prometheus, Loki, Promtail, AWS IoT SiteWise, Apache Cassandra, Elasticsearch, MySQL, PostgreSQL, AWS CloudWatch, and Google Cloud Monitoring.
This broad integration model makes Grafana useful across many monitoring and observability scenarios rather than limiting it to a single platform. Grafana was originally developed by Torkel Odegard in 2014 and first focused on monitoring systems such as InfluxDB, Graphite, and Prometheus.
- Interactive dashboards: Build dashboards with charts, tables, heatmaps, and other visualizations.
- Multiple data sources: Connect data from multiple systems and view it in one place.
- Alerting: Send metric-based notifications through email, Slack, or other supported channels when conditions are met.
- Flexible customization: Customize dashboard layouts, queries, and visual styles to match operational needs.
- Extensible plugins: Add third-party plugins for additional visualizations and data-source integrations.
-
Download the Grafana package and place it under
/etc.bash~$ sudo su ~# wget https://dl.grafana.com/oss/release/grafana-11.2.2.linux-amd64.tar.gz ~# tar -zxvf grafana-v11.2.2.linux-amd64.tar.gz ~# cp grafana-v11.2.2.linux-amd64/etc/grafana -
Create a systemd service so Grafana runs in the background.
bash~$ sudo nano /etc/systemd/system/grafana.servicebash[Unit] Description=Grafana [Service] User=root ExecStart=/etc/grafana/bin/grafana-server -homepath /etc/grafana/ web [Install] WantedBy=default.target -
Reload systemd, then start and enable the Grafana service.
bash~$ sudo systemctl daemon-reload ~$ sudo systemctl start grafana.service ~$ sudo systemctl enable grafana.service ~$ sudo systemctl status grafana.service -
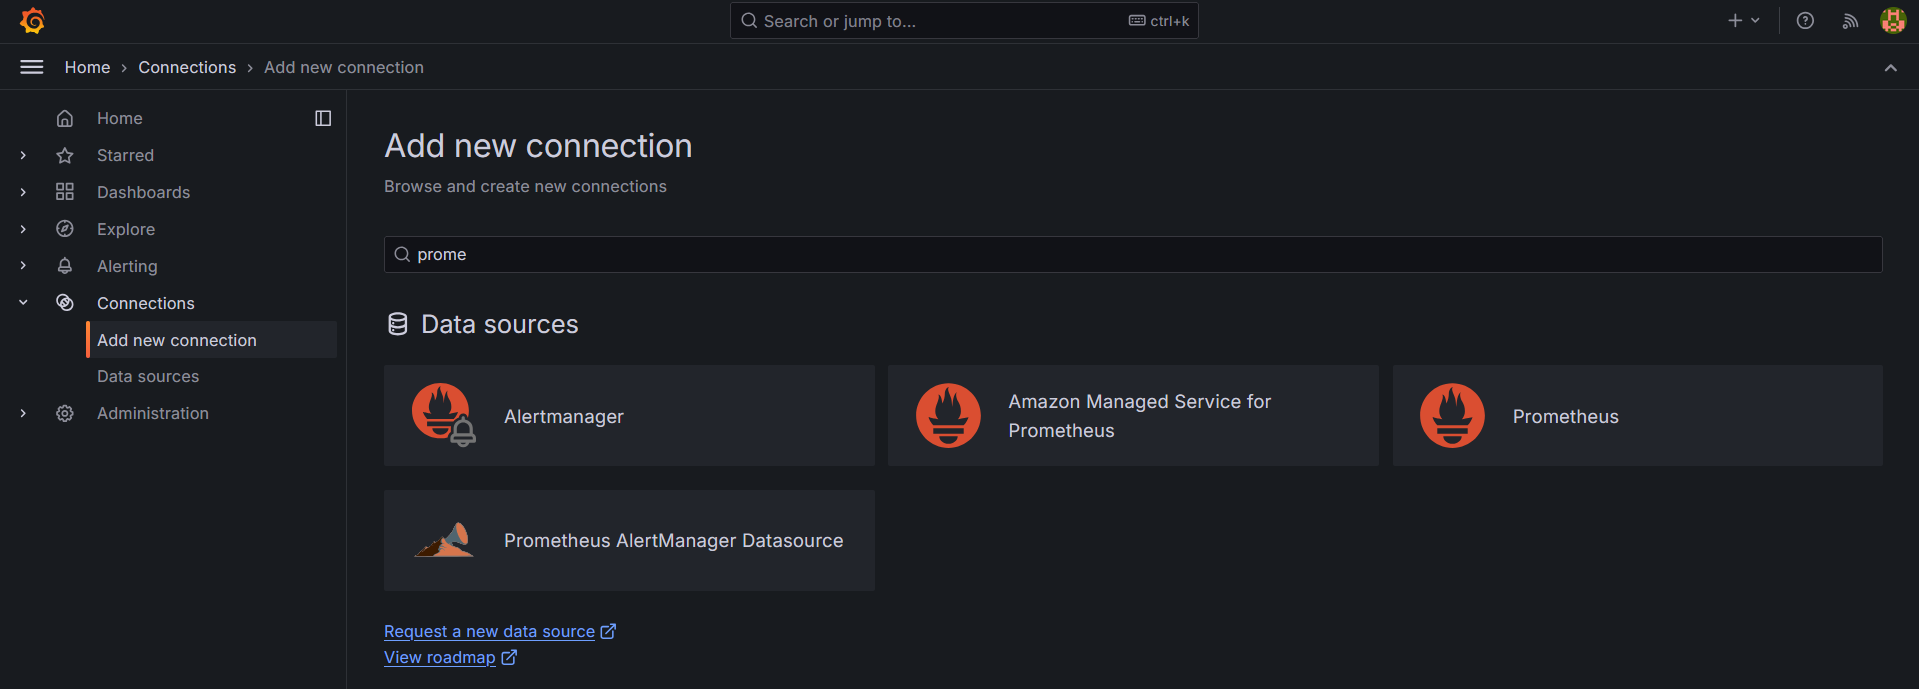
Configure Grafana to read data from Prometheus. In the left-hand menu, open "Connections", select "Add new connection", and choose "Prometheus" as the data source.
-
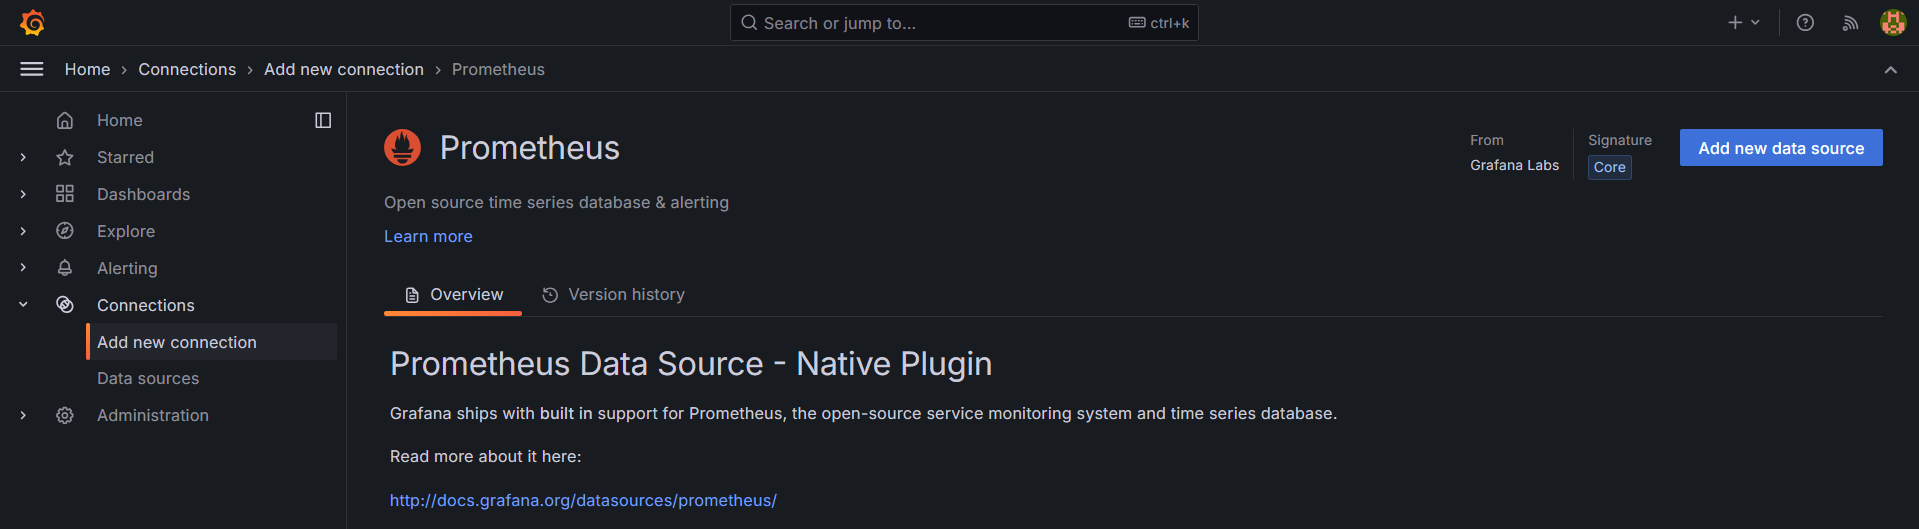
Select "Add new data source" in the upper-right corner.
-
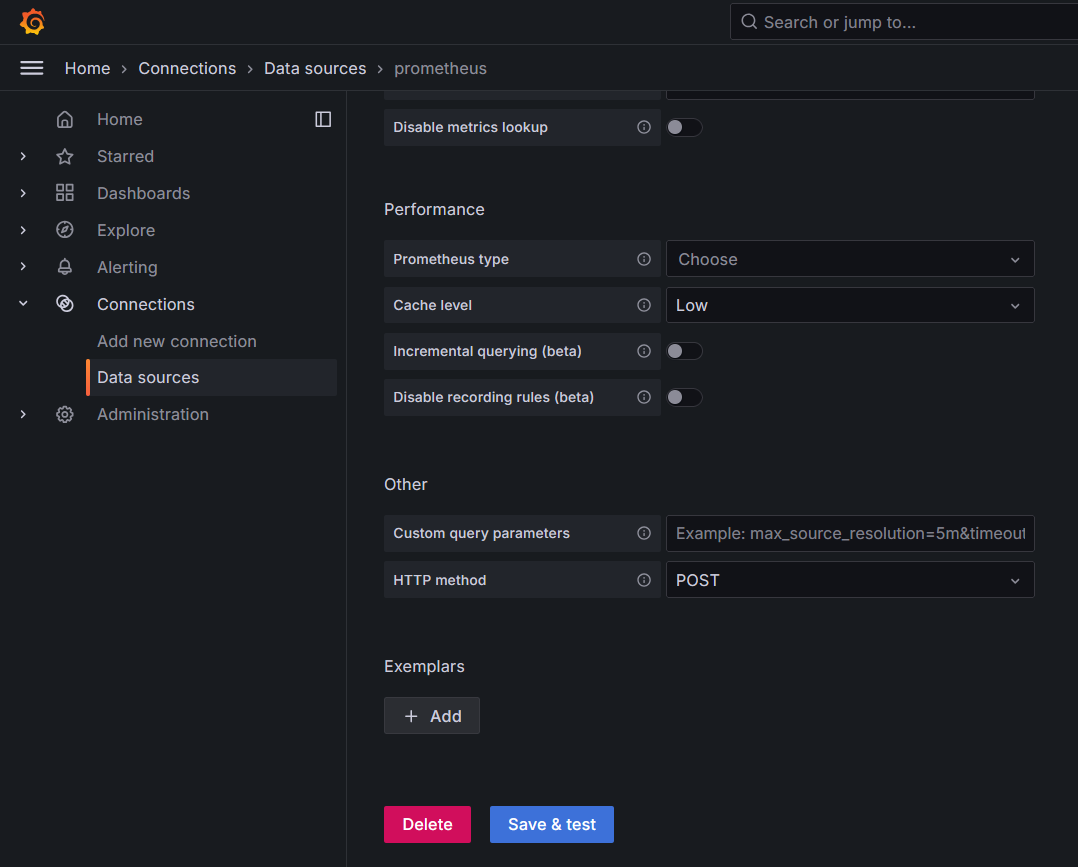
Enter a name for the "Data source" and the "Prometheus server URL". If Prometheus is not configured with TLS, use a regular
httpURL.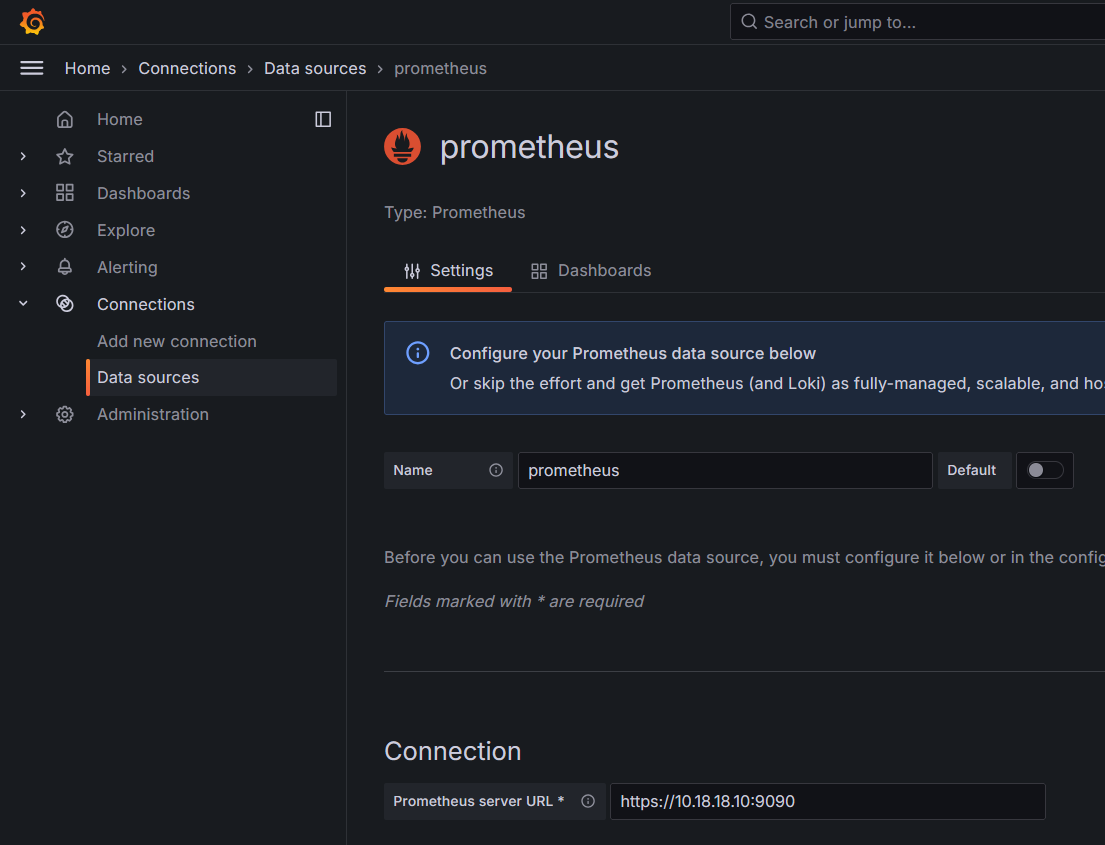
-
If Prometheus uses a self-signed certificate, enable "TLS settings - Add self-signed certificate" and provide the Prometheus
.crtfile. Skip this step when Prometheus is not using TLS.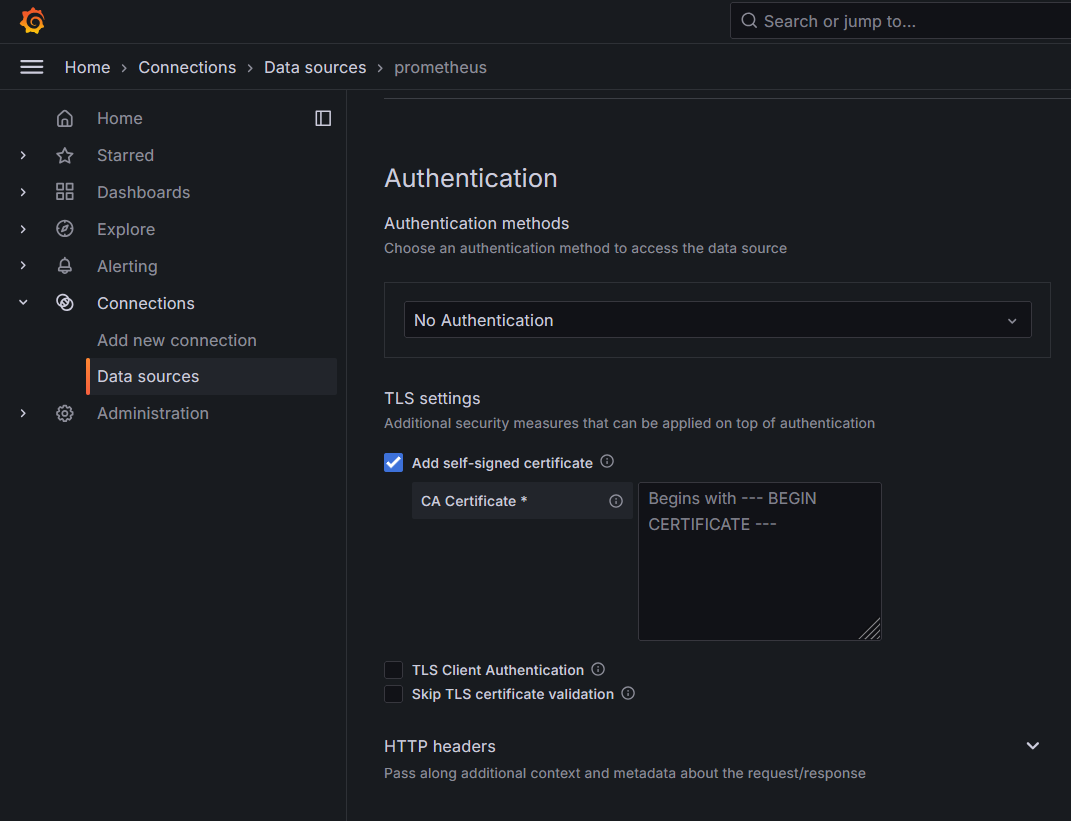
-
Select "Save & Test" to verify the connection.