Secure Prometheus
Modern infrastructure is increasingly automated, and teams need reliable monitoring without manually collecting CPU, memory, disk, or network-traffic data. Prometheus addresses this need by collecting metrics in real time with minimal human intervention.
Visualization is equally important when monitoring systems, applications, and servers. Grafana provides a flexible and widely adopted way to turn Prometheus metrics into operational dashboards.
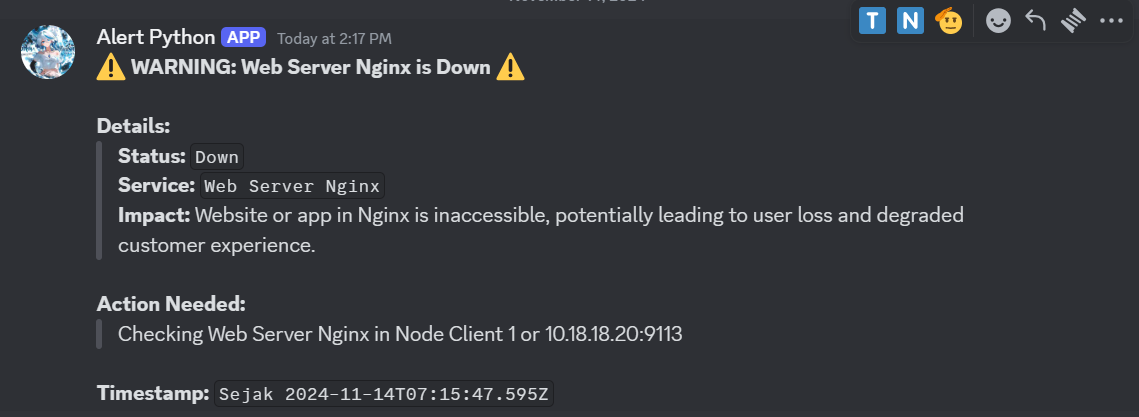
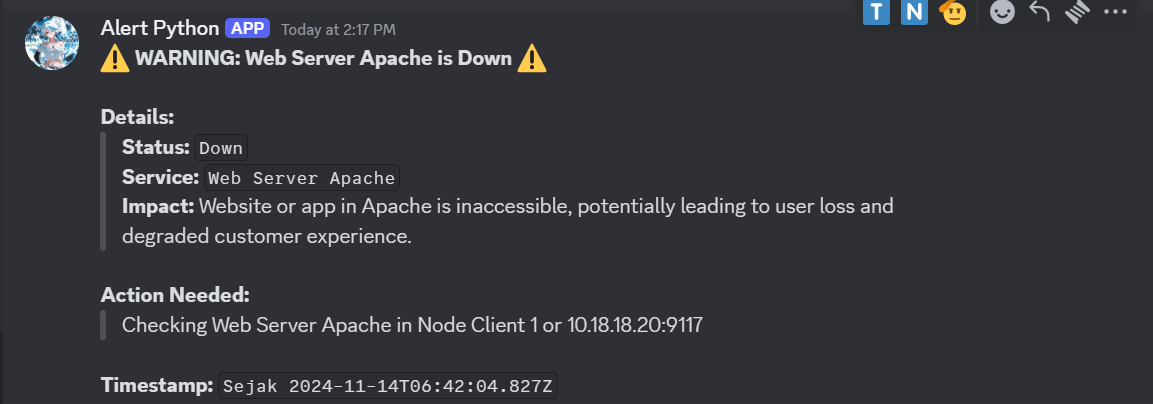
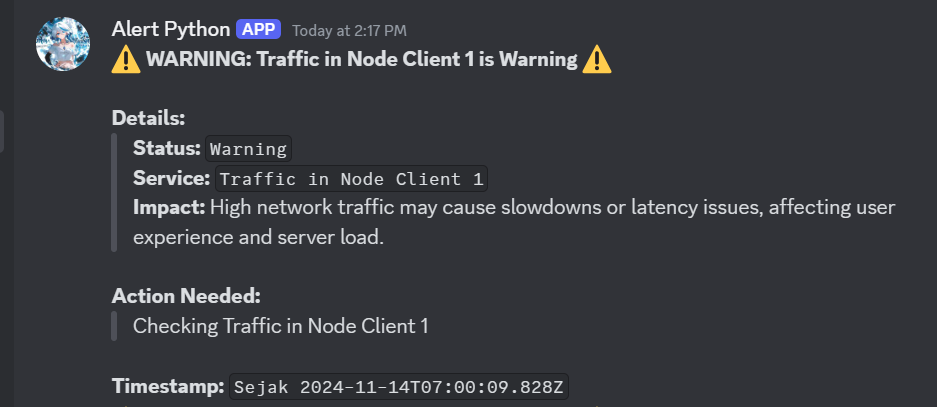
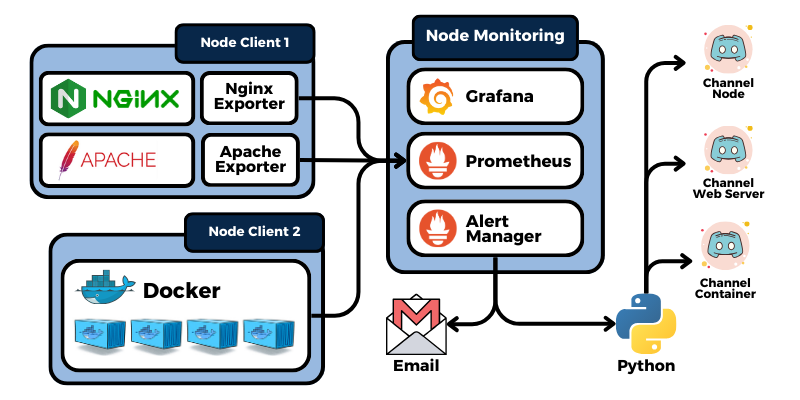
Alerting provides an early warning when a service goes down or when suspicious traffic, such as a DoS or DDoS pattern, is detected. Prometheus Alertmanager routes notifications through Discord, email, and webhook endpoints so teams can respond before an incident causes wider damage.
Serta dibutuhkan juga Alerting agar dapat memberikan peringatan dini terkait semisal adanya ganguan pada system yang menyebabkan system down, atau semisal ada terkait ancaman Cyber crime seprti DoS atau DDoS. Alert Manager Prometheus yang mengambil peran ini, yang nantinya akan mengirimkan peringatan apabila terjadi hal – hal tadi, sehingga meminimalisir terjadinya kerusakan pada system atau aplikasi kita. Alert Manager sendiri dapat di integrasikan dengan beberapa tools untuk notifikasi lain seperti Discord, Email atau WebHook Endpoint. Sehingga lebih fleksible dalam penggunaan alerting nya.
- Prometheus – 2.48.1
- Grafana – 11.2.2
- Alert Manager – 0.26.0
- Node Exporter – 1.8.2
- Nginx – 1.10.0
- Nginx Exporter – 0.11.0
- Apache2 – 2.4.52
- Apache Exporter – 1.0.3
- Docker – 27.3.1
- cAdvisor
- Python – 3.10.12
- Discord
Apache
Apache adalah salah satu software web server gratis dan open source, yang memungkinkan pengguna mengupload website nya ke internet. Apache sendiri sudah hampir menjadi platform website bagi kurang lebih 33% website di dunia, dengan nama resmi “Apache HTTP Server”. Apache pertama kali dirilis pada tahun 1995 dan dikelola oleh “Apache Software Foundation”.
Nginx
NGINX (Engine-X) is a widely used web server for hosting websites and applications. It is also commonly used as an HTTP server, reverse proxy, and load balancer.
Exporter Prometheus
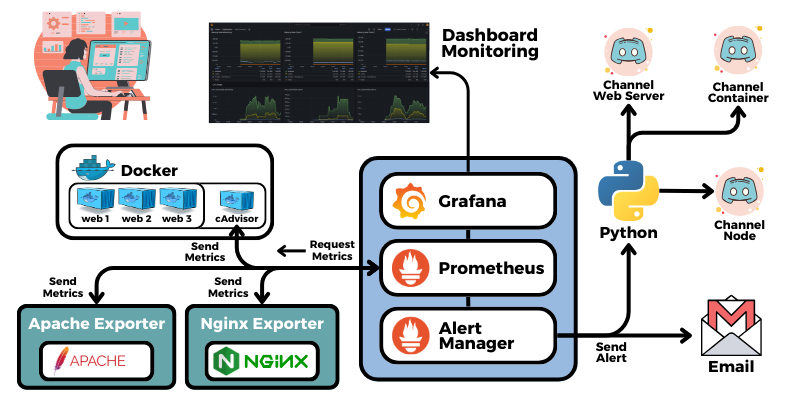
Prometheus exporters convert application or system metrics into a format that Prometheus can scrape. They act as adapters between the monitored service and Prometheus.
CAdvisor
cAdvisor (Container Advisor) monitors container performance and collects metrics such as CPU usage, memory usage, network traffic, and disk I/O for each running container.
SSL (Secure Sockets Layer)
SSL merupakan Protocol keamanan yang digunakan untuk mengenkrip si data seperti informasi pribadi, password, rekening, dan data lain yang bersifat sensitif, saat data dikirim kan ke server, data tersebut akan di enkripsi untuk menjaga keamanan dari data tersebut. SSL sertifikat yaitu sertifikat digital digunakan untuk autentikasi indentitas dari situs web yang memungkinkan koneksi enkripsi yang aman. Dan sering digunakan untuk menjaga keamanan data pengguna yang perlu memverifikasi kepemilikan situs website.
<br>1. Configure SSL Certificates for the Services
- Create an IP SAN file for each server or node.
~$ sudo nano /etc/ssl/IP_SANS.txt
subjectAltName=IP:<IP dari setiap Server / Node>
-
Buat directory untuk menyimpan CA di dalam directory “/etc/ssl/” agar lebih rapi serta mudah di identifikasi.
- Monitoring node
bash# Prometheus ~$ sudo mkdir -p /etc/ssl/prometheus ~$ sudo mkdir -p /etc/ssl/prometheus/cert/ ~$ sudo mkdir -p /etc/ssl/prometheus/cert/<IP atau Domain dari Prometheus>/ # Prometheus targets ~$ sudo mkdir -p /etc/ssl/node_exporter/ ~$ sudo mkdir -p /etc/ssl/apache_exporter/ ~$ sudo mkdir -p /etc/ssl/nginx_exporter/- Client node 1
bash# Node Exporter ~$ sudo mkdir -p /etc/ssl/node_exporter/ # Apache ~$ sudo mkdir -p /etc/ssl/apache/ ~$ sudo mkdir -p /etc/ssl/apache/client/ ~$ sudo mkdir -p /etc/ssl/nginx- Client node 2
bash# Node Exporter ~$ sudo mkdir -p /etc/ssl/node_exporter/ -
Create certificates for the following services:
-
Prometheus
bash~$ sudo openssl genrsa -out /etc/ssl/prometheus/cert/10.18.18.10:9090/10.18.18.10:9090.key 2048 ~$ sudo openssl req -sha512 -new \ -subj "/C=IN/ST=jateng/L=kendal/0=Prometheus Najwan/OU=Prometheus Najwan/CN=Prometheus Najwan>" \ -key /etc/ssl/prometheus/cert/10.18.18.10:9090/10.18.18.10:9090.key \ -out /etc/ssl/prometheus/cert/10.18.18.10:9090/10.18.18.10:9090.csr ~$ sudo openssl x509 -req -sha512 -days 3650 \ -key /etc/ssl/prometheus/cert/10.18.18.10:9090/10.18.18.10:9090.key \ -extfile /etc/ssl/IP_SANS.txt \ -in /etc/ssl/prometheus/cert/10.18.18.10:9090/10.18.18.10:9090.csr\ -out /etc/ssl/prometheus/cert/10.18.18.10:9090/10.18.18.10:9090.crt -
Node Exporter
bash~$ sudo openssl genrsa -out /etc/ssl/node_exporter/node_exporter.key 2048 ~$ sudo openssl req -sha512 -new \ -subj "/C=IN/ST=jateng/L=kendal/0=Node Exporter Najwan/OU=Node Exporter Najwan/CN=Node Exporter Najwan>" \ -key /etc/ssl/node_exporter/node_exporter.key \ -out /etc/ssl/node_exporter/node_exporter.csr ~$ sudo openssl x509 -req -sha512 -days 3650 \ -key /etc/ssl/node_exporter/node_exporte.key \ -extfile /etc/ssl/IP_SANS.txt \ -in /etc/ssl/node_exporter/node_exporte.csr\ -out /etc/ssl/node_exporter/node_exporte.crt -
Apache2 web service and Apache Exporter ```bash ~$ sudo openssl genrsa -out /etc/ssl/apache/apache.key 2048
~$ sudo openssl req -sha512 -new \
    -subj "/C=IN/ST=jateng/L=kendal/0=Apache Najwan/OU=Apache Najwan/CN=Apache Najwan>" \
    -key /etc/ssl/apache/apache.key \
    -out /etc/ssl/apache/apache.csr

~$ sudo openssl x509 -req -sha512 -days 3650 \
    -key /etc/ssl/apache/apache.key \
    -extfile /etc/ssl/IP_SANS.txt \
    -in /etc/ssl/apache/apache.csr\
    -out /etc/ssl/apache/apache.crt
```
- Apache2 client web server ```bash ~$ sudo openssl genrsa -out /etc/ssl/apache/client/client.key 2048
~$ sudo openssl req -sha512 -new \
    -subj "/C=IN/ST=jateng/L=kendal/0=Apache Najwan/OU=Apache Najwan/CN=Apache Najwan>" \
    -key /etc/ssl/apache/client/client.key \
    -out /etc/ssl/apache/client/client.csr

~$ sudo openssl x509 -req -sha512 -days 3650 \
    -key /etc/ssl/apache/client/client.key \
    -extfile /etc/ssl/IP_SANS.txt \
    -in /etc/ssl/apache/client/client.csr\
    -out /etc/ssl/apache/client/client.crt
```
- Nginx web service and Nginx Exporter ```bash ~$ sudo openssl genrsa -out /etc/ssl/nginx/nginx.key 2048
~$ sudo openssl req -sha512 -new \
    -subj "/C=IN/ST=jateng/L=kendal/0=Nginx Najwan/OU=Nginx Najwan/CN=Nginx Najwan>" \
    -key /etc/ssl/nginx/nginx.key \
    -out /etc/ssl/nginx/nginx.csr

~$ sudo openssl x509 -req -sha512 -days 3650 \
    -key /etc/ssl/nginx/nginx.key \
    -extfile /etc/ssl/IP_SANS.txt \
    -in /etc/ssl/nginx/nginx.csr\
    -out /etc/ssl/nginx/nginx.crt
```
2. Install Node Exporter and Configure SSL
- Download Node Exporter and place it under
/etc.
~$ wget https://github.com/prometheus/node_exporter/releases/download/v1.8.2/node_exporter-1.8.2.linux-amd64.tar.gz
~$ sudo cp node_exporter-1.8.2.linux-amd64 /etc/node_exporter/
-
Buat file “config.yml” di directory “/etc/node_exporter” yang nantinya digunakan untuk koneksi ssl.
yamltls_server_config: cert_file: /etc/ssl/node_exporter/node_exporter.crt key_file: /etc/ssl/node_exporter/node_exporter.key -
Create a systemd service so Node Exporter runs in the background.
~$ sudo /etc/systemd/system/node-exporter.service

[Unit]
Description=Node Exporter
[Service]
User=root
ExecStart=/etc/node_exporter/node_exporter \
    --web.config.file="/etc/node_exporter/config.yml"

[Install]
WantedBy=default.target
- Reload systemd, then start and enable Node Exporter.
~$ sudo systemctl daemon-reload
~$ sudo systemctl start node-exporter.service
~$ sudo systemctl enable node-exporter.service
~$ sudo systemctl status node-exporter.service
3. Install and Configure Apache with SSL
- Install Apache2 and download the source code for the 2048 application.
~$ sudo apt install apache2 -y
~$ git clone https://github.com/gabrielecirulli/2048
~$ sudo cp 2048 /var/www/html/
- Configure Apache's SSL module.
~$ sudo nano /etc/apache2/mods-available/ssl.conf
SSLProtocol all -SSLv3 -TLSv1 -TLSv1.1 +TLSv1.2 +TLSv1.3
~$ sudo a2enmod ssl
- Configure the virtual host to serve the application.
~$ sudo nano /etc/apache2/sites-available/default-ssl.conf
<VirtualHost_default_:443>
    ServerName 10.18.18.20
    DocumentRoot /var/www/html/2048
    SSLEngine on
    SSLCertificateFile      /etc/ssl/apache/apache.crt
    SSLCertificateKeyFile   /etc/ssl/apache/apache.key
    SSLCACertificateFile    /etc/ssl/apache/client/client.crt

    <Location "/server-status">
        SetHandler server-status
    </Location>
~$ sudo a2ensite default-ssl.conf
- Restart the Apache2 service.
~$ udo systemctl restart apache2.service
~$ udo systemctl status apache2.service
4. Install and Configure Nginx with SSL
- Install Nginx and download the source code for the Tic Tac Toe application.
~$ sudo apt install nginx -y
~$ git clone https://github.com/Aklilu-Mandefro/javascript-Tic-Tac-Toe-game-app)
~$ sudo cp javascript-Tic-Tac-Toe-game-app /var/www/html/
- Configure the Nginx server block to serve the application.
~$ sudo nano /etc/nginx/sites-available/default
server {
  listen 443 ssl default_server;
  listen [::]: 443 ssl default_server;

  root /var/www/html/javascript-Tic-Tac-Toe-game-app/;
  index index.html;
  ssl_certificate      /etc/ssl/nginx/nginx.crt;
  ssl_certificate_key  /etc/ssl/nginx/nginx.key;
  ssl_protocols        TLSv1 TLSv1.1 TLSv1.2 TLSv1.3;
  ssl_ciphers          HIGH:!aNULL:!MD5;

  location / {
        try_files $uri $uri/ =404;
  }

  location = /server-status {
        stub_status on;
  }
}
- Restart the Nginx service.
~$ sudo systemctl restart nginx.service
~$ sudo systemctl status nginx.service
5. Install Apache Exporter with SSL
- Download Apache Exporter and place it under
/etc.
~$ wget https://github.com/Lusitaniae/apache_exporter/releases/download/v1.0.3/apache_exporter-1.0.3.linux-amd64.tar.gz
~$ tar xvzf apache_exporter-1.0.3.linux-amd64.tar.gz
~$ sudo cp apache_exporter-1.0.3.linux-amd64 /etc/apache_exporter
-
Buat file “config.yml” di directory “/etc/apache_exporter” yang nantinya digunakan untuk koneksi ssl.
yamltls_server_config: cert_file: /etc/ssl/apache_exporter/apache_exporter.crt key_file: /etc/ssl/apache_exporter/apache_exporter.key -
Create a systemd service so Apache Exporter runs in the background.
~$ sudo /etc/systemd/system/apache-exporter.service
[Unit]
Description=Apache Exporter
[Service]
User=root
ExecStart=/etc/apache_exporter/apache_exporter \
     --scrape_url="https://{IP_SERVER_APACHE}:443/server-status?auto" \
     --web.config.file="/etc/apache_exporter/config.yml" \
     --insecure

[Install]
WantedBy=default.target
- Reload systemd, then start and enable the exporter service.
~$ sudo systemctl daemon-reload
~$ sudo systemctl start node-exporter.service
~$ sudo systemctl enable node-exporter.service
~$ sudo systemctl status node-exporter.service
6. Install Nginx Exporter with SSL
- Download Nginx Exporter and place it under
/etc.
 ~$ wget https://github.com/nginxinc/nginx-prometheus-exporter/releases/download/v0.11.0/nginx-prometheus-exporter_0.11.0_linux_amd64.tar.gz
 ~$ tar -xvzf nginx-prometheus-exporter_0.11.0_linux_amd64.tar.gz
 ~$ sudo cp nginx-prometheus-exporter_0.11.0_linux_amd64 /etc/nginx_exporter
-
Buat file “config.yml” di directory “/etc/nginx_exporter” yang nantinya digunakan untuk koneksi ssl.
yamltls_server_config: cert_file: /etc/ssl/nginx_exporter/nginx_exporter.crt key_file: /etc/ssl/nginx_exporter/nginx_exporter.key -
Create a systemd service so Nginx Exporter runs in the background.
~$ sudo /etc/systemd/system/nginx-exporter.service
[Unit]
Description=Nginx Exporter
Wants=network-online.target
After=network-online.target

[Service]
User=root
ExecStart=/etc/nginx_exporter/nginx-prometheus-exporter \
     -nginx.scrape-uri=https://{IP_SERVER_NGINX}:443/server-status
     -nginx.ssl-ca-cert="/etc/ssl/nginx/nginx.crt" \
     -web.secured-metrics=true \
     -web.ssl-server-cert="/etc/ssl/nginx/nginx.crt" \
     -web.ssl-server-key="/etc/ssl/nginx/nginx.key"

[Install]
WantedBy=default.target
- Reload systemd, then start and enable Nginx Exporter.
~$ sudo systemctl daemon-reload
~$ sudo systemctl start nginx-exporter.service
~$ sudo systemctl enable nginx-exporter.service
~$ sudo systemctl status nginx-exporter.service
7. Install Docker
The following packages are required for the Docker setup:
docker-ce                # Main Docker package
docker-ce-cli            # Docker CLI package
containerd.io            # Docker container runtime package
docker-buildx-plugin     # Docker image build package
docker-compose-plugin    # Docker Compose package
For the detailed installation procedure, see the Install Docker post.
<br>8. Install cAdvisor to Monitor Docker Containers
- Run the cAdvisor container.
~$ docker run -d \
    --volume=/:/rootfs:ro \
    --volume=/var/run:/var/run:ro \
    --volume=/sys:/sys:ro \
    --volume=/var/lib/docker/:/var/lib/docker:ro \
    --volume=/dev/disk/:/dev/disk:ro \
    --publish=8080:8080 \
    --detach=true \
    --name=cadvisor\
    gcr.io/cadvisor/cadvisor:latest

~$ docker ps -a
9. Install and Configure Prometheus with SSL
-
Follow the Prometheus post for the base installation, then continue with the configuration below to add TLS.
-
Buat file “web-config.yml” di directory “/etc/prometheus/” yang nantinya digunakan untuk koneksi ssl.
yamltls_server_config: cert_file: /path/to/prometheus_ca.crt key_file: /path/to/prometheus_ca.key -
Lalu edit di bagian Service, di bagian ExecStart. terus tambahkan untuk path dari file config untuk TLS/SSL dengan "--web.config.file".
bash~$ sudo nano /etc/systemd/system/prometheus_server.servicebashUser=root ExecStart=/etc/prometheus/prometheus \ --config.file=/etc/prometheus/config.yml \ --web.external-url=https://10.18.18.10:9090/ \ --web.config.file=/etc/prometheus/web-config.yml -
Edit
/etc/prometheus/config.ymlto configure Alertmanager, alerting rules, scrape targets, and TLS. This example monitors:- Three nodes using Node Exporter
- Apache2 and Nginx web services
- Docker containers
global:
  scrape_interval: 15s
  evaluation_interval: 15s

alerting:
  alertmanagers:
    - static_configs:
        - targets:
          - 10.18.18.10:9093

rule_files:
  - "rules-web-server.yml"
  - "rules-container.yml"
  - "rules-node.yml"

scrape_configs:
  - job_name: "prometheus"
    scheme: https
    tls_config:
      ca_file: "/etc/prometheus/certs/10.18.18.10:9090/10.18.18.10:9090.crt"
    static_configs:
    - targets: ["10.18.18.10:9090"]

  - job_name: 'apache-exporter-client01'
    scheme: https
    tls_config:
      ca_file: "/etc/prometheus/apache/apache.crt"
    static_configs:
    - targets: ['10.18.18.20:9117']

  - job_name: 'nginx-exporter-client01'
    scheme: https
    tls_config:
      ca_file: "/etc/prometheus/nginx/nginx.crt"
      insecure_skip_verify: true
    static_configs:
    - targets: ['10.18.18.20:9113']

  - job_name: 'node monitoring'
    scheme: https
    tls_config:
      ca_file: "/etc/prometheus/node_exporter/node_exporter_monitoring.crt"
    static_configs:
    - targets: ['10.18.18.10:9100']

  - job_name: 'node client01'
    scheme: https
    tls_config:
      ca_file: "/etc/prometheus/node_exporter/node_exporter_client01.crt"
    static_configs:
    - targets: ['10.18.18.20:9100']

  - job_name: 'node client02'
    scheme: https
    tls_config:
      ca_file: "/etc/prometheus/node_exporter/node_exporter_client02.crt"
    static_configs:
    - targets: ['10.18.18.30:9100']

  - job_name: 'docker-node-client02'
    static_configs:
    - targets: ['10.18.18.30:9323']

  - job_name: 'cAdvisor-client02'
    static_configs:
    - targets: ['10.18.18.30:8080']
10. Install Grafana
Follow the Grafana post for installation, configuration, and data-source setup over HTTPS or regular HTTP.
<br>11. Install Alertmanager
Follow the Alertmanager post for the base installation. The project in this guide adds the notification configuration shown below.
- Configure Alertmanager with three notification destinations: email, a Discord webhook, and a webhook endpoint connected to a Python filter.
global:
  resolve_timeout: 15s

route:
  receiver: discord-all
  routes:
  - receiver: discord-python
    continue: true
  - receiver: email

receivers:
# Email integration
- name: email
  email_configs:
  - to: "email@test.id"
    from: "email@test.id"
    smarthost: smtp.gmail.com:587
    auth_username: "email@test.id"
    auth_identity: "email@test.id"
    auth_password: "TOKEN_EMAIL"
    send_resolved: True

# Discord webhook integration
- name: discord-all
  discord_configs:
  - webhook_url: 'URL_WEBHOOKS_DISCORD'

# Python integration
- name: discord-python
  webhook_configs:
  - url: "URL_ENDPOINT_PYTHON"
-
Configure the rules that trigger Alertmanager notifications. Replace
{PERLU_UBAH}with{{ $value }}where required.- Rules for an unavailable Apache or Nginx web server.
yamlgroups: - name: nginx.rules rules: - alert: nginxDown expr: nginx_up == 0 for: 1m annotations: summary: "Service Nginx Down" description: "Nginx has been down for one minute. Please investigate." - name: apache.rules rules: - alert: apacheDown expr: apache_up == 0 for: 1m annotations: summary: "Service Apache Down" description: "Apache has been down for one minute. Please investigate."- Rules for stopped or unavailable containers.
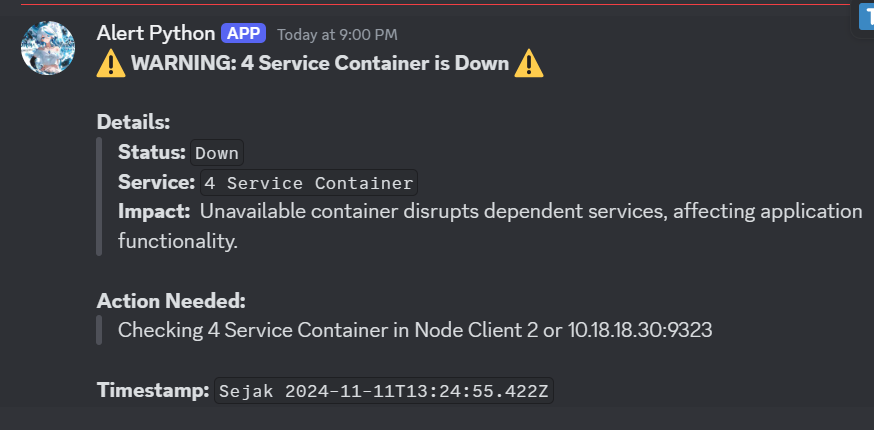
yamlgroups: - name: container.rules rules: - alert: containerDown expr: engine_daemon_container_states_containers{state="stopped"} > 0 for: 1m labels: valueService: "{PERLU_UBAH}" annotations: summary: "{PERLU_UBAH} Service container Down" description: "{PERLU_UBAH} container service has been down for one minute. Please investigate."- Rules for available CPU on every server or node.
yamlgroups: - name: cpu-free-under-35-monitoring.rules rules: - alert: cpu-free-under-35-monitoring expr: (sum by(mode) (rate(node_cpu_seconds_total{job=~"node monitoring", mode='idle'}[1h])) / 2) * 100 < 35 for: 5s labels: nodeName: "Node Monitoring" cpuUsage: "{PERLU_UBAH}" - name: cpu-free-under-35-client01.rules rules: - alert: cpu-free-under-35-client01 expr: (sum by(mode) (rate(node_cpu_seconds_total{job=~"node client01", mode='idle'}[1h])) / 2) * 100 < 35 for: 5s labels: nodeName: "Node Client 1" cpuUsage: "{PERLU_UBAH}" - name: cpu-free-under-35-client02.rules rules: - alert: cpu-free-under-35-client02 expr: (sum by(mode) (rate(node_cpu_seconds_total{job=~"node client02" mode='idle'}[1h])) / 2) * 100 < 35 for: 5s labels: nodeName: "Node Client 2" cpuUsage: "{PERLU_UBAH}"- Rules for available memory on every server or node.
yamlgroups: - name: memory-available-under-35-Monitoring.rules rules: - alert: memory-available-under-35-Monitoring expr: (node_memory_MemAvailable_bytes{job="node monitoring"} / node_memory_MemTotal_bytes{job="node monitoring"}) * 100 < 35 for: 5s labels: nodeName: "Node Monitoring" memUsage: "{PERLU_UBAH}" - name: memory-available-under-35-client01.rules rules: - alert: memory-available-under-35-client01 expr: (node_memory_MemAvailable_bytes{job="node client01"} / node_memory_MemTotal_bytes{job="node client01"}) * 100 < 35 for: 5s labels: nodeName: "Node Client 1" memUsage: "{PERLU_UBAH}" - name: memory-available-under-35-client02.rules rules: - alert: memory-available-under-35-client02 expr: (node_memory_MemAvailable_bytes{job="node client02"} / node_memory_MemTotal_bytes{job="node client02"}) * 100 < 35 for: 5s labels: nodeName: "Node Client 2" memUsage: "{PERLU_UBAH}"- Rules for disk usage that exceeds the threshold on each server or node.
yamlgroups: - name: disk-usage-75-persen-node-monitoring.rules rules: - alert: disk-usage-75-persen-node-monitoring expr: ((1 - (sum(node_filesystem_avail_bytes{instance="10.18.18.10:9100"})) / sum(node_filesystem_size_bytes{instance="10.18.18.10:9100"})) * 100) > 75 for: 5s labels: nodeName: "Node Monitoring" diskUsage: "{PERLU_UBAH}" - name: disk-usage-75-persen-node-client01.rules rules: - alert: disk-usage-75-persen-node-client01 expr: ((1 - (sum(node_filesystem_avail_bytes{instance="10.18.18.20:9100"})) / sum(node_filesystem_size_bytes{instance="10.18.18.20:9100"})) * 100) > 75 for: 5s labels: nodeName: "Node Client 1" diskUsage: "{PERLU_UBAH}" - name: disk-usage-75-persen-node-client02.rules rules: - alert: disk-usage-75-persen-node-client02 expr: ((1 - (sum(node_filesystem_avail_bytes{instance="10.18.18.30:9100"})) / sum(node_filesystem_size_bytes{instance="10.18.18.30:9100"})) * 100) > 75 for: 5s labels: nodeName: "Node Client 2" diskUsage: "{PERLU_UBAH}"- Rules for network traffic spikes on each server or node.
yamlgroups: - name: record-traffic-node-monitoring rules: - record: job:node_network_receive_total_monitoring:rate50s expr: rate(node_network_receive_bytes_total{job="node monitoring", device="lo"}[50s]) / (1024*1024) - name: traffic-monitoring.rules rules: - alert: traffic-monitoring expr: job:node_network_receive_total_monitoring:rate50s > 3 for: 0s labels: nodeName: "Node Monitoring" trafficUsage: "{PERLU_UBAH}" - name: record-traffic-node-client01 rules: - record: job:node_network_receive_total_client01:rate50s expr: rate(node_network_receive_bytes_total{job="node client01", device="lo"}[50s]) / (1024*1024) - name: traffic-client01.rules rules: - alert: traffic-client01 expr: job:node_network_receive_total_client01:rate50s > 3 for: 0s labels: nodeName: "Node Client 1" trafficUsage: "{PERLU_UBAH}" - name: record-traffic-node-client02 rules: - record: job:node_network_receive_total_client02:rate50s expr: rate(node_network_receive_bytes_total{job="node client02", device="lo"}[50s]) / (1024*1024) - name: traffic-client02.rules rules: - alert: traffic-client02 expr: job:node_network_receive_total_client02:rate50s > 3 for: 0s labels: nodeName: "Node Client 2" trafficUsage: "{PERLU_UBAH}"
12. Add a Python Program to Filter Discord Notifications
-
Obtain a Discord token so the Python program can send notifications to the correct channel. This YouTube guide covers the token-generation step.
-
Download the sample Python program from this GitHub repository to filter alerts and route them to different channels. Follow the setup instructions in the repository.
A. Node and Server Monitoring
-
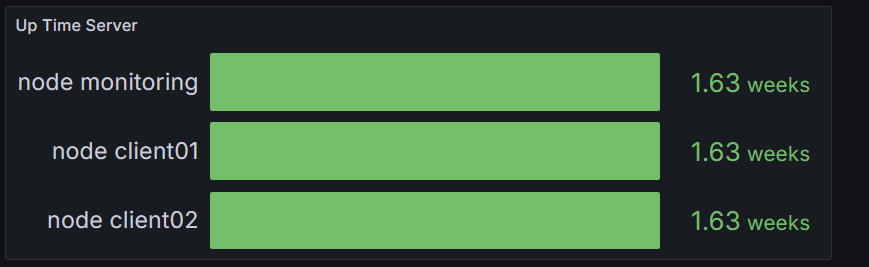
Node and server uptime
-
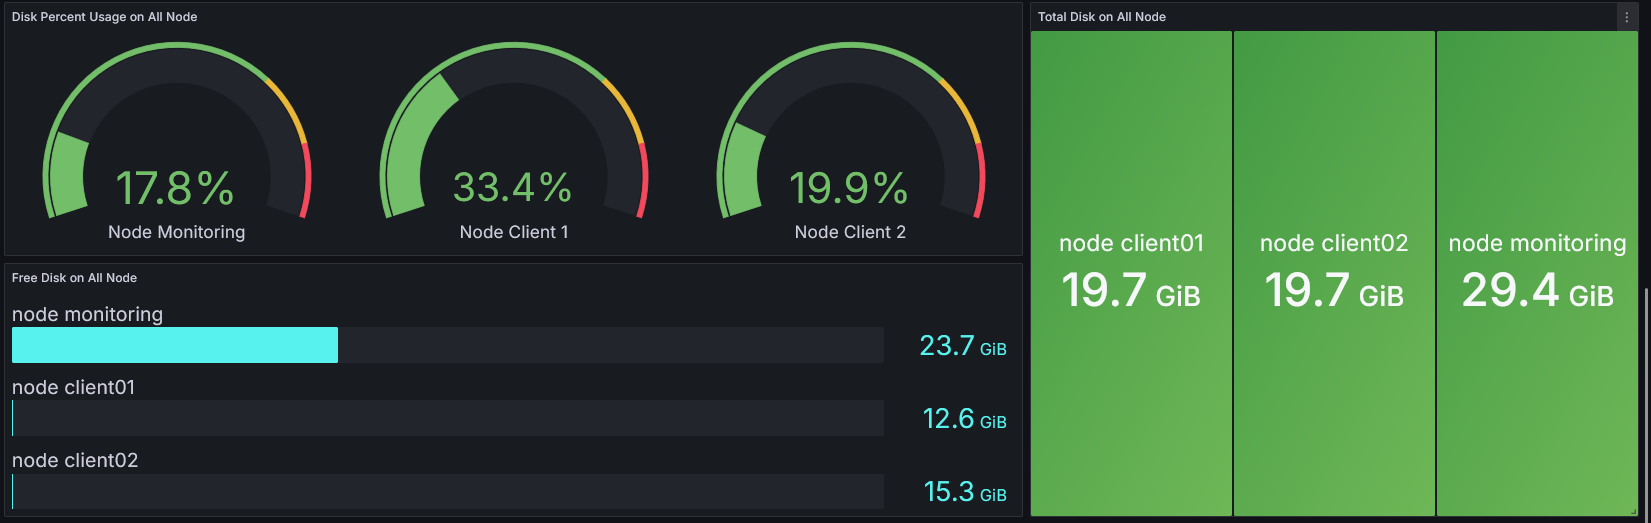
Disk usage
-
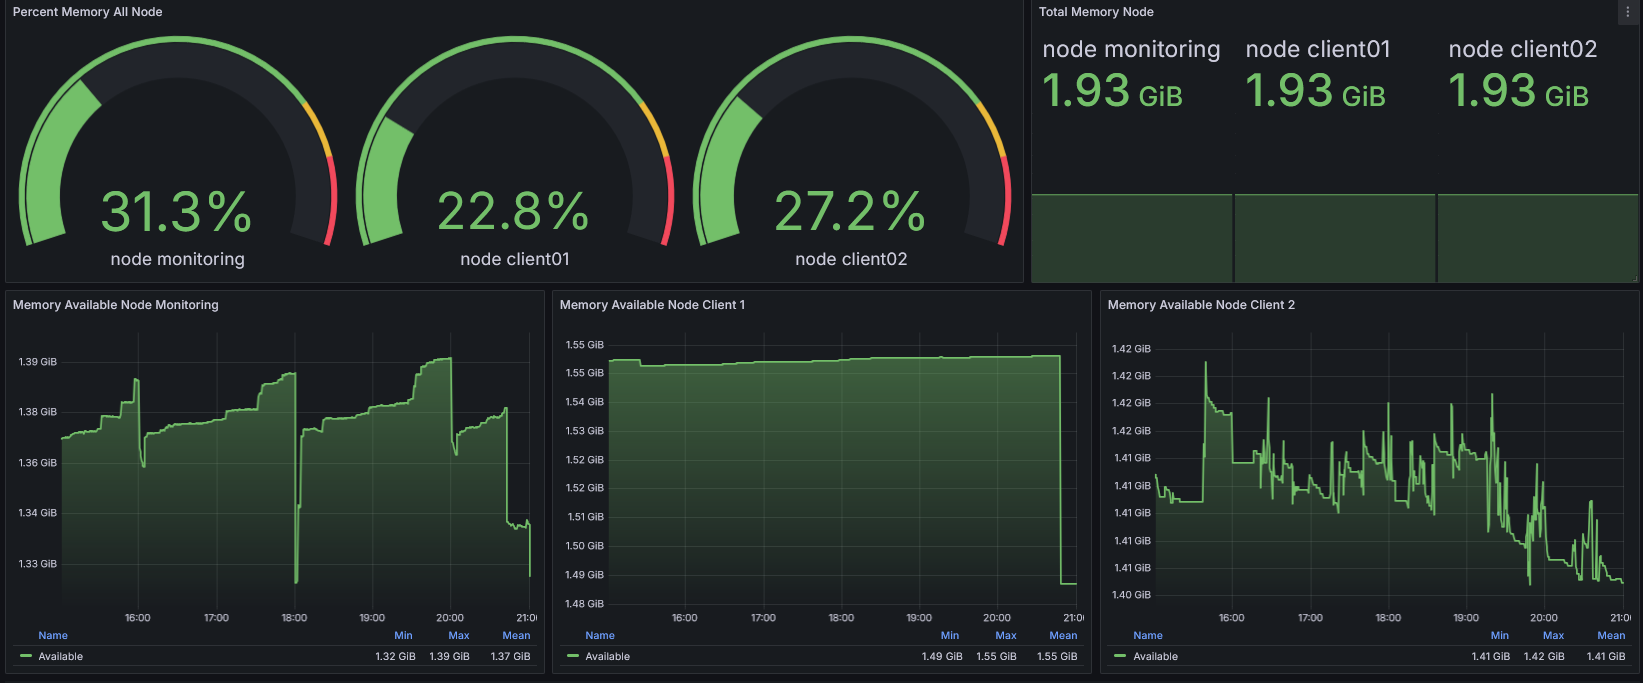
Memory usage
-
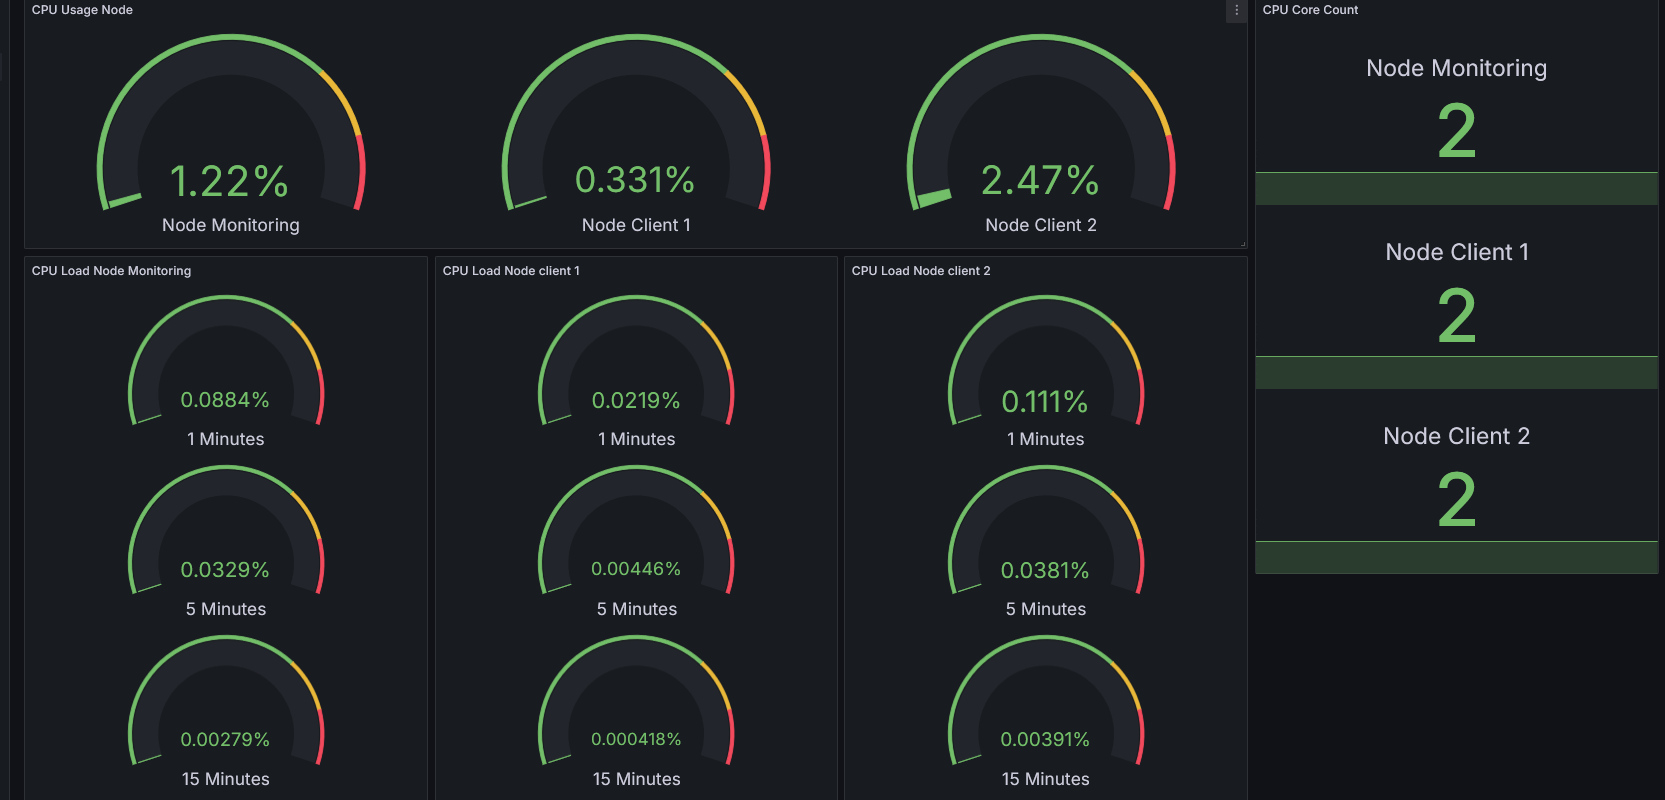
CPU usage
-
Network traffic

B. Container Monitoring
-
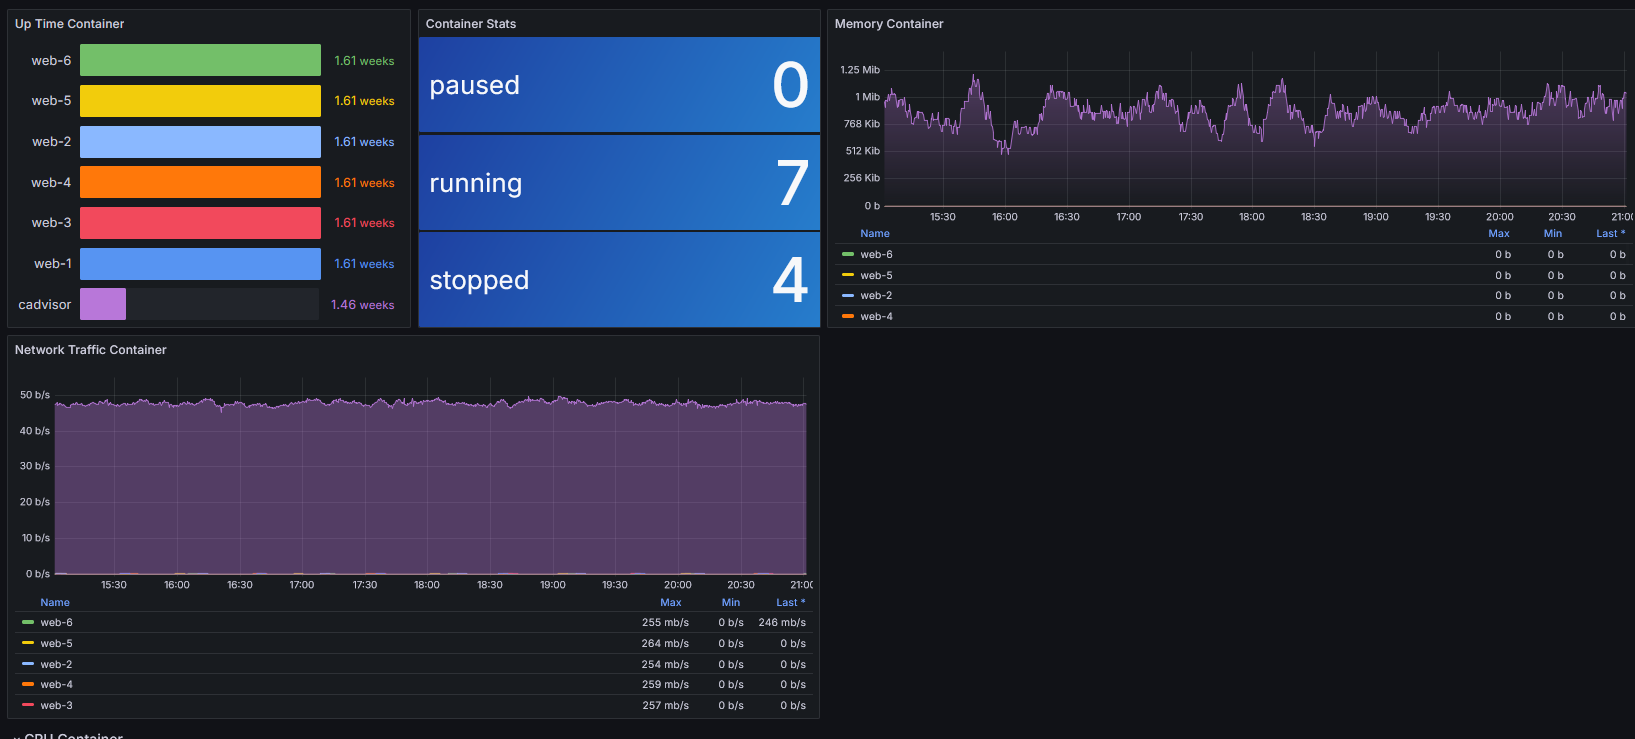
Container status
-
Container CPU usage

C. Web Server Monitoring
-
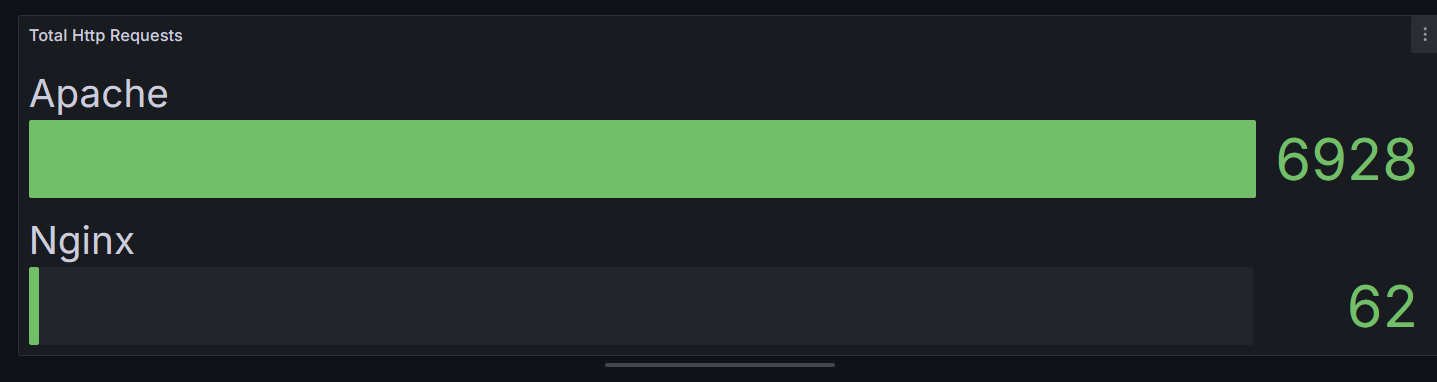
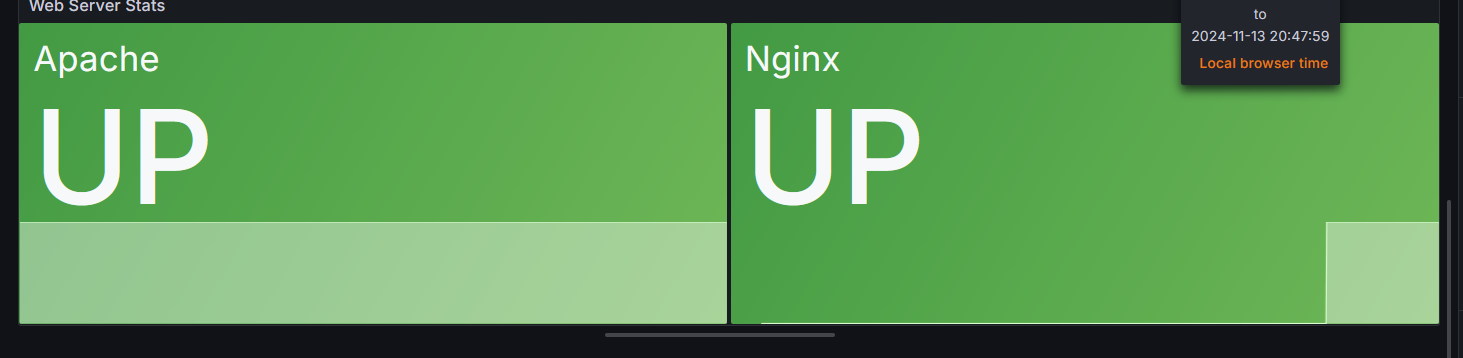
Web server statistics
-
Total web server requests