Expose Local Apps with Traefik and Ngrok in Docker
When you build a homelab on a local VM, you may eventually want to share a project with teammates or friends. This guide combines Traefik and Ngrok to expose selected local services through a controlled public URL.
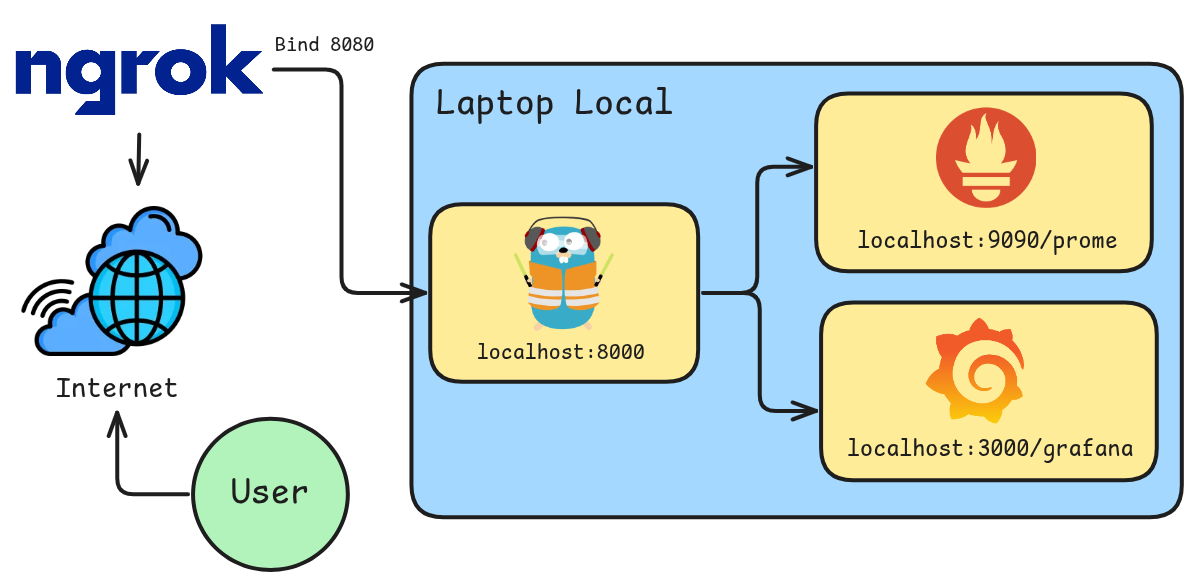
Traefik is a reverse proxy, load balancer, and API gateway. Think of it as a "gatekeeper": when a request arrives, Traefik reads the routing rules and forwards the request to the correct application.
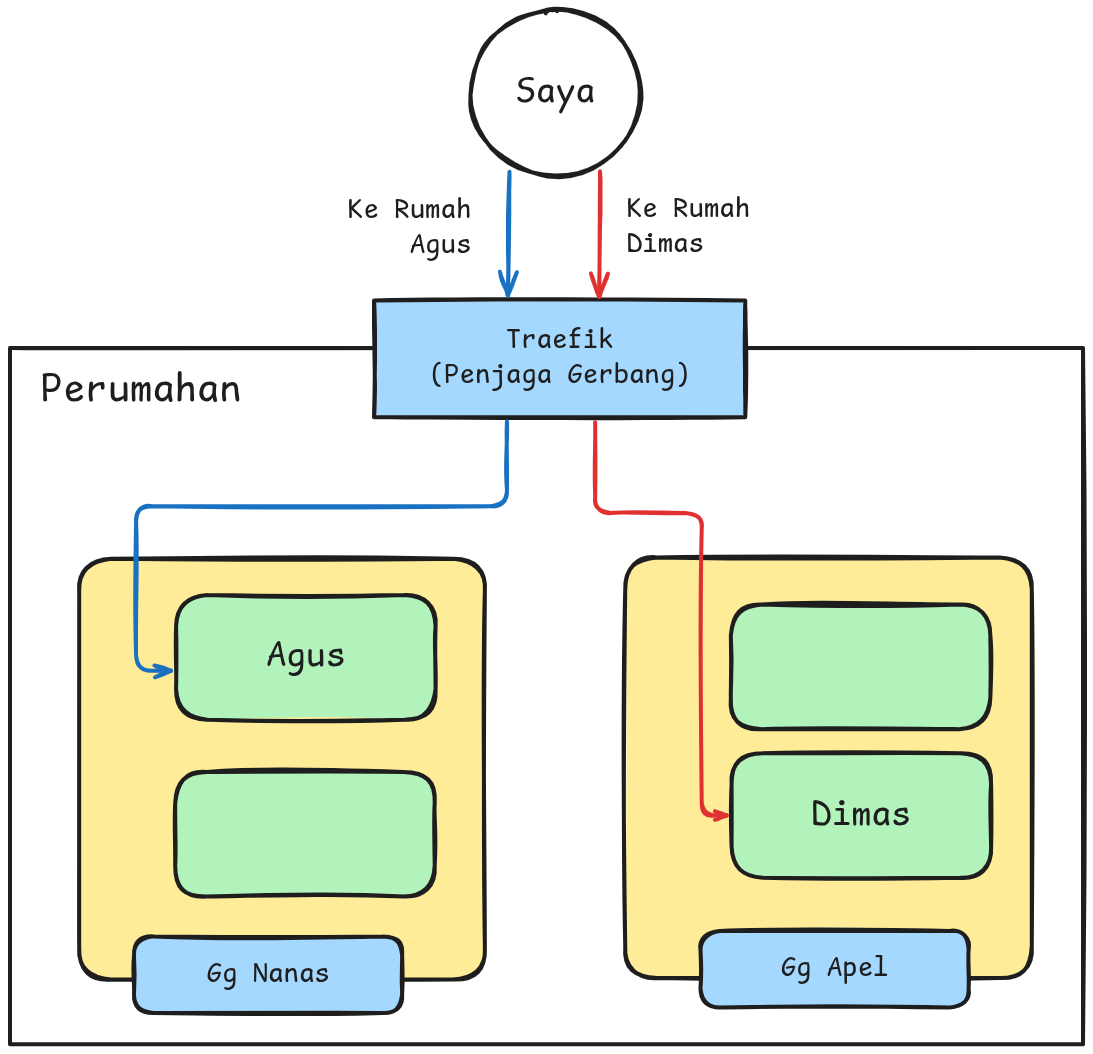
For example, requests to /prome can be routed to Prometheus on port 9090. The client only needs to access the Traefik port, such as http://localhost:8000/prome.
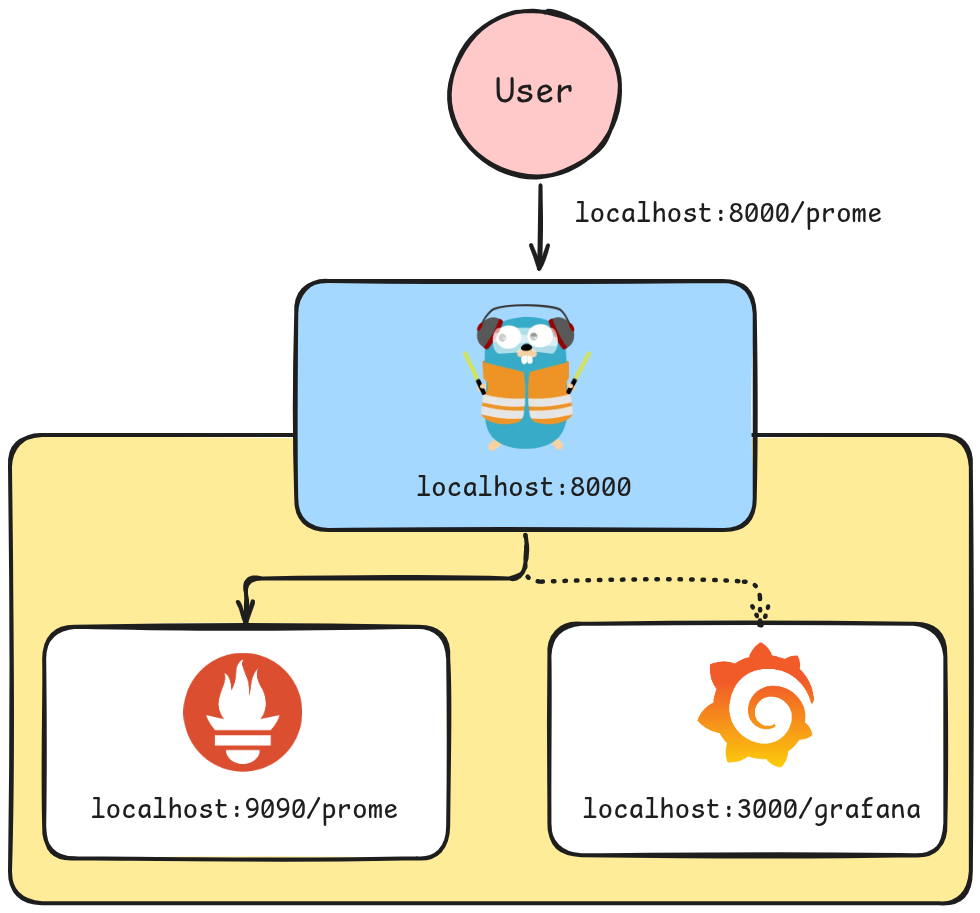
The sections below explain both tools, including their strengths and trade-offs.
Traefik is a modern reverse proxy and load balancer designed for deploying microservices. It discovers configuration dynamically from providers such as Docker and Kubernetes by inspecting metadata such as Docker Compose labels in real time.
| Keuntungan | Penjelasan |
|---|---|
| Automatic configuration (auto-discovery) | No need to restart Traefik whenever a container is added or removed; providers such as Docker labels expose the new service automatically. |
| Automatic SSL certificates | Built-in Let's Encrypt integration can obtain and renew SSL/TLS certificates for your domains. |
| Well suited to microservices | Its dynamic design integrates closely with Docker, Swarm, and Kubernetes. |
| API and web dashboard | Provides a visual dashboard for routers, services, and middleware. |
| Flexible middleware | Add rate limiting, basic authentication, header manipulation, and prefix stripping. |
| Kekurangan | Penjelasan |
|---|---|
| Initial learning curve | Routers, services, middleware, and entrypoints can be unfamiliar to engineers used to static Nginx configuration. |
| Initial TLS complexity | Let's Encrypt setup, especially with a DNS challenge, can require additional configuration. |
| Provider dependency | Traefik relies on provider metadata such as Docker labels; invalid metadata can prevent a service from working. |
Ngrok provides reverse proxy and tunneling capabilities that make a local service reachable from the internet. On the free tier, one public URL can be used to expose a single service at a time.
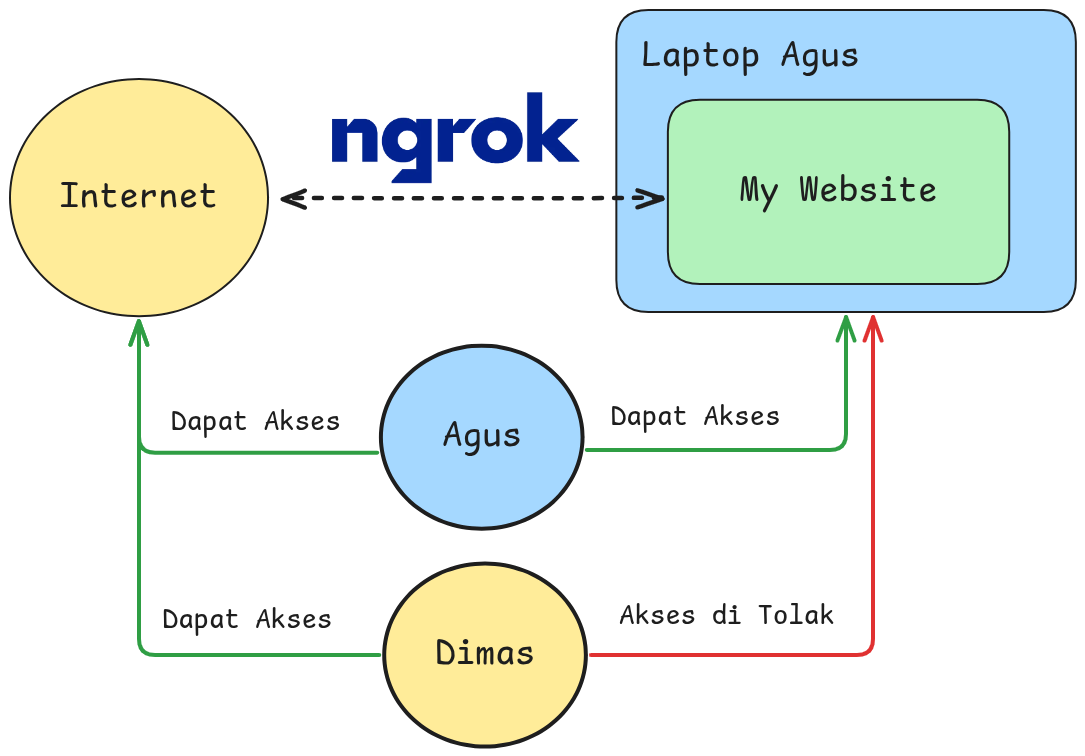
Anyone other than the laptop owner reaches the local website through the configured public Ngrok URL. The owner can still access the service locally or through the public endpoint.
| Keuntungan | Penjelasan |
|---|---|
| Instant local exposure | Expose a local web service without configuring router port forwarding. |
| Useful for testing and demos | Test webhooks from services such as PayPal or Stripe, or demonstrate an application to a client. |
| Secure tunneling | Ngrok provides a TLS-encrypted HTTPS tunnel even when the local service uses HTTP. |
| Traffic inspection | A local web UI makes incoming and outgoing HTTP requests easy to inspect during debugging. |
| Kekurangan | Penjelasan |
|---|---|
| Temporary free URL | The free tier assigns a public URL that changes when the tunnel restarts. |
| Free-tier connection and bandwidth limits | Rate and session limits make the free tier unsuitable for sustained production use. |
| Not ideal for long-term production | Even with a custom domain, Ngrok is an external dependency and is rarely the primary reverse proxy for highly available production services. |
| Third-party dependency | If Ngrok's cloud service is unavailable, the local service cannot be reached externally. |
- Minimum RAM: 9 GB (16 GB recommended)
- CPU: 4 cores
- Storage: 35 GB
This example runs Prometheus in Docker. Start by creating docker-compose.yml.
nano docker-compose.yml
- Add the following Prometheus service configuration.
yaml
services:
  prometheus:
    image: prom/prometheus:latest
    container_name: prometheus
    ports:
      - "9090:9090"
    command:
      - '--config.file=/etc/prometheus/prometheus.yml'
      - '--web.route-prefix=/'
    volumes:
      - ./prome/prometheus.yaml:/etc/prometheus/prometheus.yml:ro
    labels:
      - "traefik.enable=true"
      - "traefik.http.routers.prom.rule=PathPrefix(`/prome`)"
      - "traefik.http.routers.prom.entrypoints=web"
      - "traefik.http.middlewares.prom-strip.stripprefix.prefixes=/prome"
      - "traefik.http.routers.prom.middlewares=prom-strip"
      - "traefik.http.services.prom.loadbalancer.server.port=9090"
    networks:
      - monitoring
Configuration Notes
| Bagian | Baris Konfigurasi | Penjelasan Singkat | Detail Teknis |
|---|---|---|---|
command | --config.file=/etc/prometheus/prometheus.yml | Points Prometheus to a specific configuration file. | Tells Prometheus where to find prometheus.yml inside the container. |
--web.route-prefix=/ | Sets the URL prefix for the Prometheus web interface. | Keeps the interface at the service root path (/); Traefik handles the external prefix through its labels. | |
volumes | ./prome/prometheus.yaml:/etc/prometheus/prometheus.yml:ro | Mounts the local configuration file into the container. | The local prometheus.yaml file is mounted read-only, so Prometheus cannot modify it. |
labels | "traefik.enable=true" | Enables Traefik for the service. | Traefik reads this and the remaining labels for the container. |
traefik.http.routers.prom.rule=PathPrefix("/prome") | Defines URL-based routing. | Requests beginning with /prome are handled by this router. | |
"traefik.http.routers.prom.entrypoints=web" | Selects the router entrypoint. | The router listens on the web entrypoint, usually HTTP port 80. | |
"traefik.http.middlewares.prom-strip.stripprefix.prefixes=/prome" | Defines a prefix-stripping middleware. | The prom-strip middleware removes /prome before forwarding the request to Prometheus. | |
"traefik.http.routers.prom.middlewares=prom-strip" | Attaches the middleware to the router. | A request to /prome/graph is forwarded to /graph in Prometheus. | |
"traefik.http.services.prom.loadbalancer.server.port=9090" | Defines the internal service port. | Traefik forwards requests to Prometheus on port 9090 inside the container. |
-
Create the Prometheus configuration at
./prome/prometheus.yaml.bashmkdir prome cd prome nano prometheus.yaml -
Use the following scrape configuration. This example uses Prometheus as the only target and does not yet integrate additional exporters.
yamlglobal: scrape_interval: 15s scrape_configs: - job_name: "prometheus" static_configs: - targets: ["localhost:9090"]
-
Open
docker-compose.ymlagain.bashnano docker-compose.yml -
Add the following Grafana service configuration.
yamlservices: grafana: image: grafana/grafana:latest container_name: grafana ports: - "3000:3000" environment: - GF_SERVER_ROOT_URL=http://172.1.1.12:3000/grafana/ - GF_SERVER_SERVE_FROM_SUB_PATH=true volumes: - grafana-storage:/var/lib/grafana labels: - "traefik.enable=true" - "traefik.http.routers.grafana.rule=PathPrefix(`/grafana`)" - "traefik.http.services.grafana.loadbalancer.server.port=3000" - "traefik.http.routers.grafana.entrypoints=web" networks: - monitoring
Configuration Notes
| Bagian | Baris Konfigurasi | Penjelasan Singkat | Detail Teknis |
|---|---|---|---|
environment | GF_SERVER_ROOT_URL=http://172.1.1.12:3000/grafana/ | Sets Grafana's public base URL. | Tells Grafana how to generate internal links for the /grafana/ subpath and port 3000. |
GF_SERVER_SERVE_FROM_SUB_PATH=true | Enables subpath hosting. | Required when Grafana runs behind a reverse proxy at a path such as /grafana; it keeps CSS and JavaScript assets working. | |
volumes | grafana-storage:/var/lib/grafana | Persists Grafana data. | Stores the database, dashboards, and related data in the grafana-storage Docker volume. |
labels | "traefik.enable=true" | Enables Traefik for Grafana. | Traefik reads the remaining labels to configure routing. |
"traefik.http.routers.grafana.rule=PathPrefix(\/grafana`)"` | Defines URL-based routing. | Requests beginning with /grafana are sent to the Grafana service. | |
"traefik.http.services.grafana.loadbalancer.server.port=3000" | Defines the internal Grafana port. | Traefik forwards traffic to port 3000 inside the container. | |
"traefik.http.routers.grafana.entrypoints=web" | Selects the router entrypoint. | The router listens on the web entrypoint, typically HTTP port 80 or 8080. |
-
Open
docker-compose.ymlagain.bashnano docker-compose.yml -
Add the Traefik service together with the network and Grafana storage configuration.
yamlservices: traefik: image: traefik:v3.1 container_name: traefik command: - "--entrypoints.web.address=:9000" - "--providers.docker=true" - "--api.dashboard=true" - "--log.level=info" - "--api.insecure=true" ports: - "9000:9000" # main Prometheus and Grafana endpoint volumes: - /var/run/docker.sock:/var/run/docker.sock networks: - monitoring volumes: grafana-storage: networks: monitoring: driver: bridge -
Start the three services.
bashdocker-compose up -d -
Wait for the services to start. If a container exits, inspect its logs with:
bashdocker logs {SERVICE_NAME} # exp: docker logs prome docker logs traefik docker logs grafana
Docker Compose Configuration Notes
| Bagian | Baris Konfigurasi | Penjelasan Singkat | Detail Teknis |
|---|---|---|---|
command | --entrypoints.web.address=:9000 | Defines the HTTP entrypoint listened to by Traefik. | Creates a web entrypoint on port 9000, used by the Prometheus and Grafana routers. |
--providers.docker=true | Enables Docker provider auto-discovery. | Traefik watches the Docker socket and reads labels from running containers. | |
--api.dashboard=true | Enables the Traefik API and dashboard. | Exposes the interactive dashboard for monitoring routers and services. | |
--log.level=info | Sets the logging level. | Records INFO, warning, and error messages for troubleshooting. | |
--api.insecure=true | Allows unauthenticated dashboard access. | Use only for local development. Do not expose this setting on an untrusted network. | |
ports | 9000:9000 | Publishes the Traefik port on the host. | Maps port 9000 in the container to port 9000 on the host. |
volumes | /var/run/docker.sock:/var/run/docker.sock | Gives Traefik access to the Docker socket. | Required for Docker provider discovery and label inspection. |
-
Create an Ngrok account if you do not already have one, then sign in.
-
Open the VM or homelab you want to expose publicly.
-
Add the Ngrok repository and install the client. The commands below target Ubuntu; adjust them for your distribution.
bashcurl -sSL https://ngrok-agent.s3.amazonaws.com/ngrok.asc \ | sudo tee /etc/apt/trusted.gpg.d/ngrok.asc >/dev/null \ && echo "deb https://ngrok-agent.s3.amazonaws.com bookworm main" \ | sudo tee /etc/apt/sources.list.d/ngrok.list \ && sudo apt update \ && sudo apt install ngrok jq -y -
Add the authentication token shown in the Ngrok dashboard.
bashngrok config add-authtoken {AUTH_TOKEN_NGROK} -
Run Ngrok as a background service instead of starting
ngrok http {PORT}manually.bashnano /etc/systemd/system/ngrok.service -
Add the following service definition and replace
{PORT_TRAEFIK}with the Traefik port. This example uses port 9000.bash[Unit] Description=Ngrok Tunnel After=network.target [Service] ExecStart=/usr/local/bin/ngrok http 9000 --log=stdout Restart=on-failure User=root StandardOutput=file:/var/log/ngrok.log StandardError=file:/var/log/ngrok_error.log [Install] WantedBy=multi-user.target -
Reload systemd, then start and enable Ngrok.
bashsudo systemctl daemon-reload sudo systemctl start ngrok sudo systemctl enable ngrok
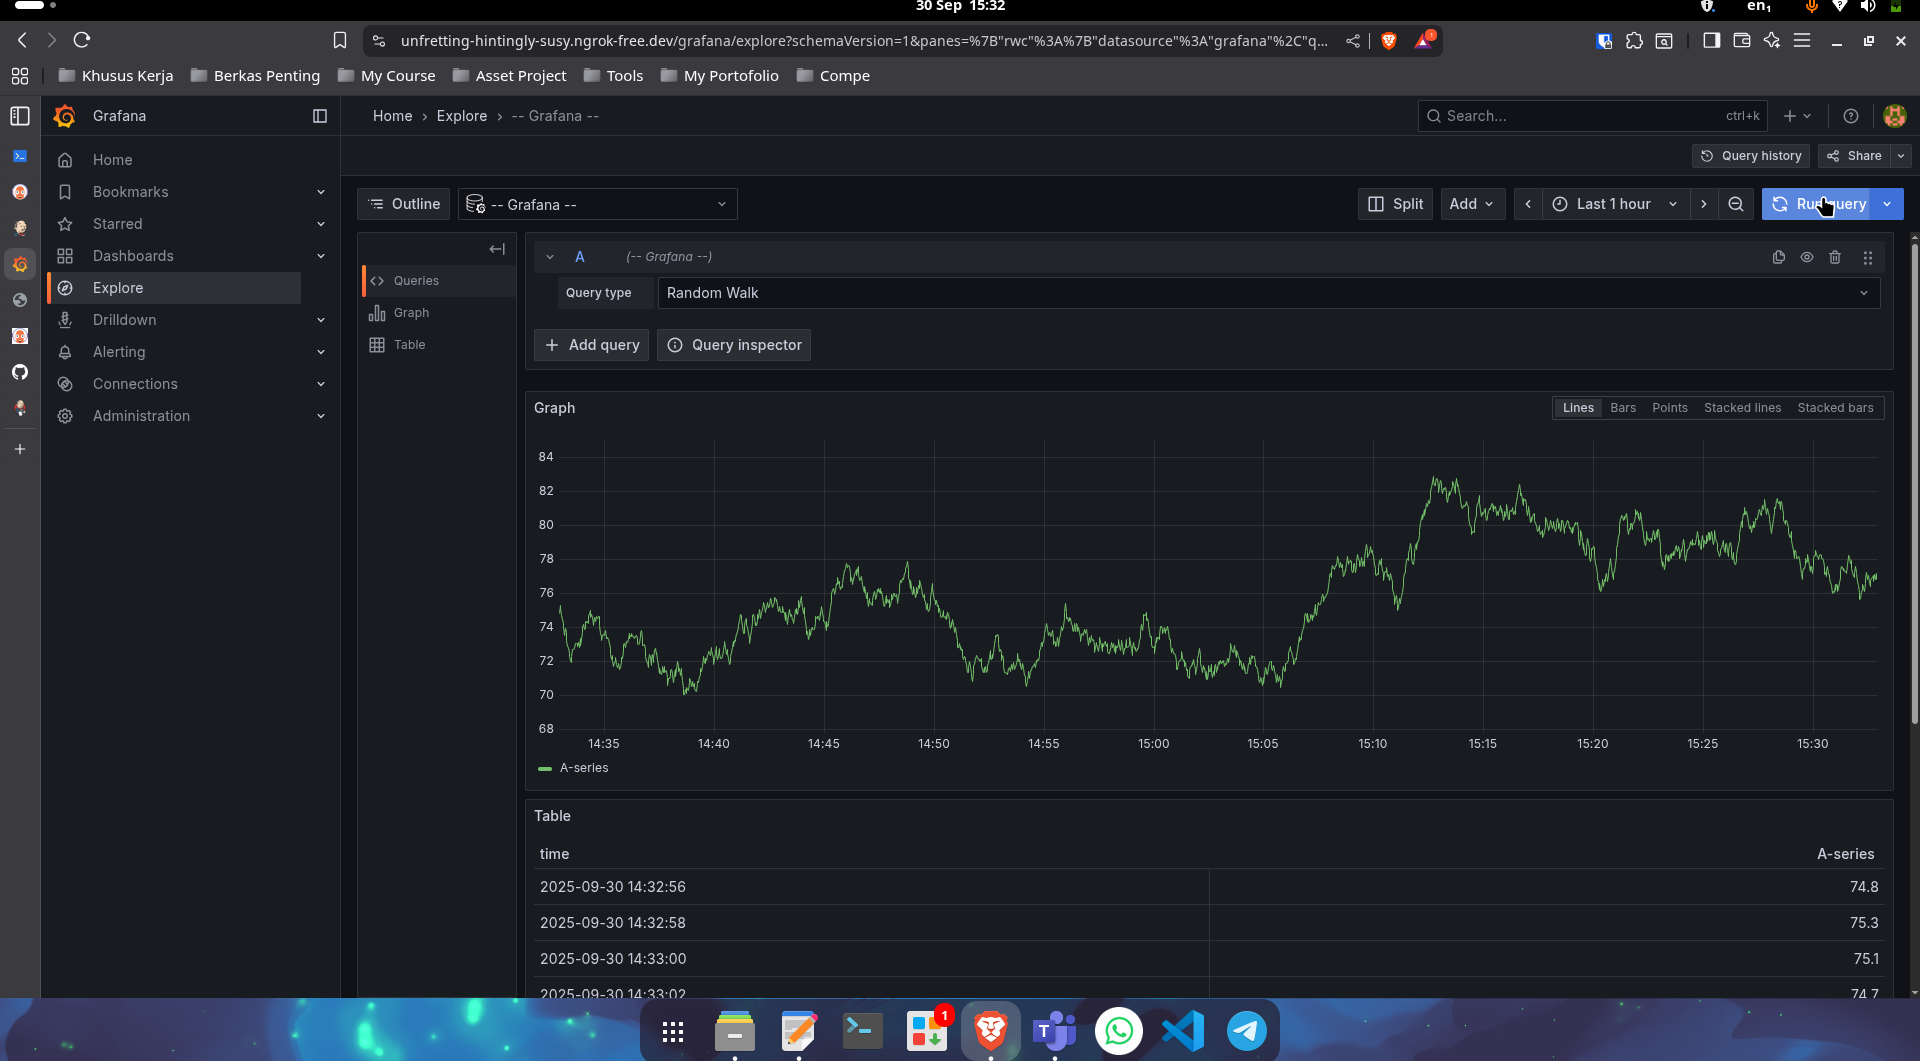
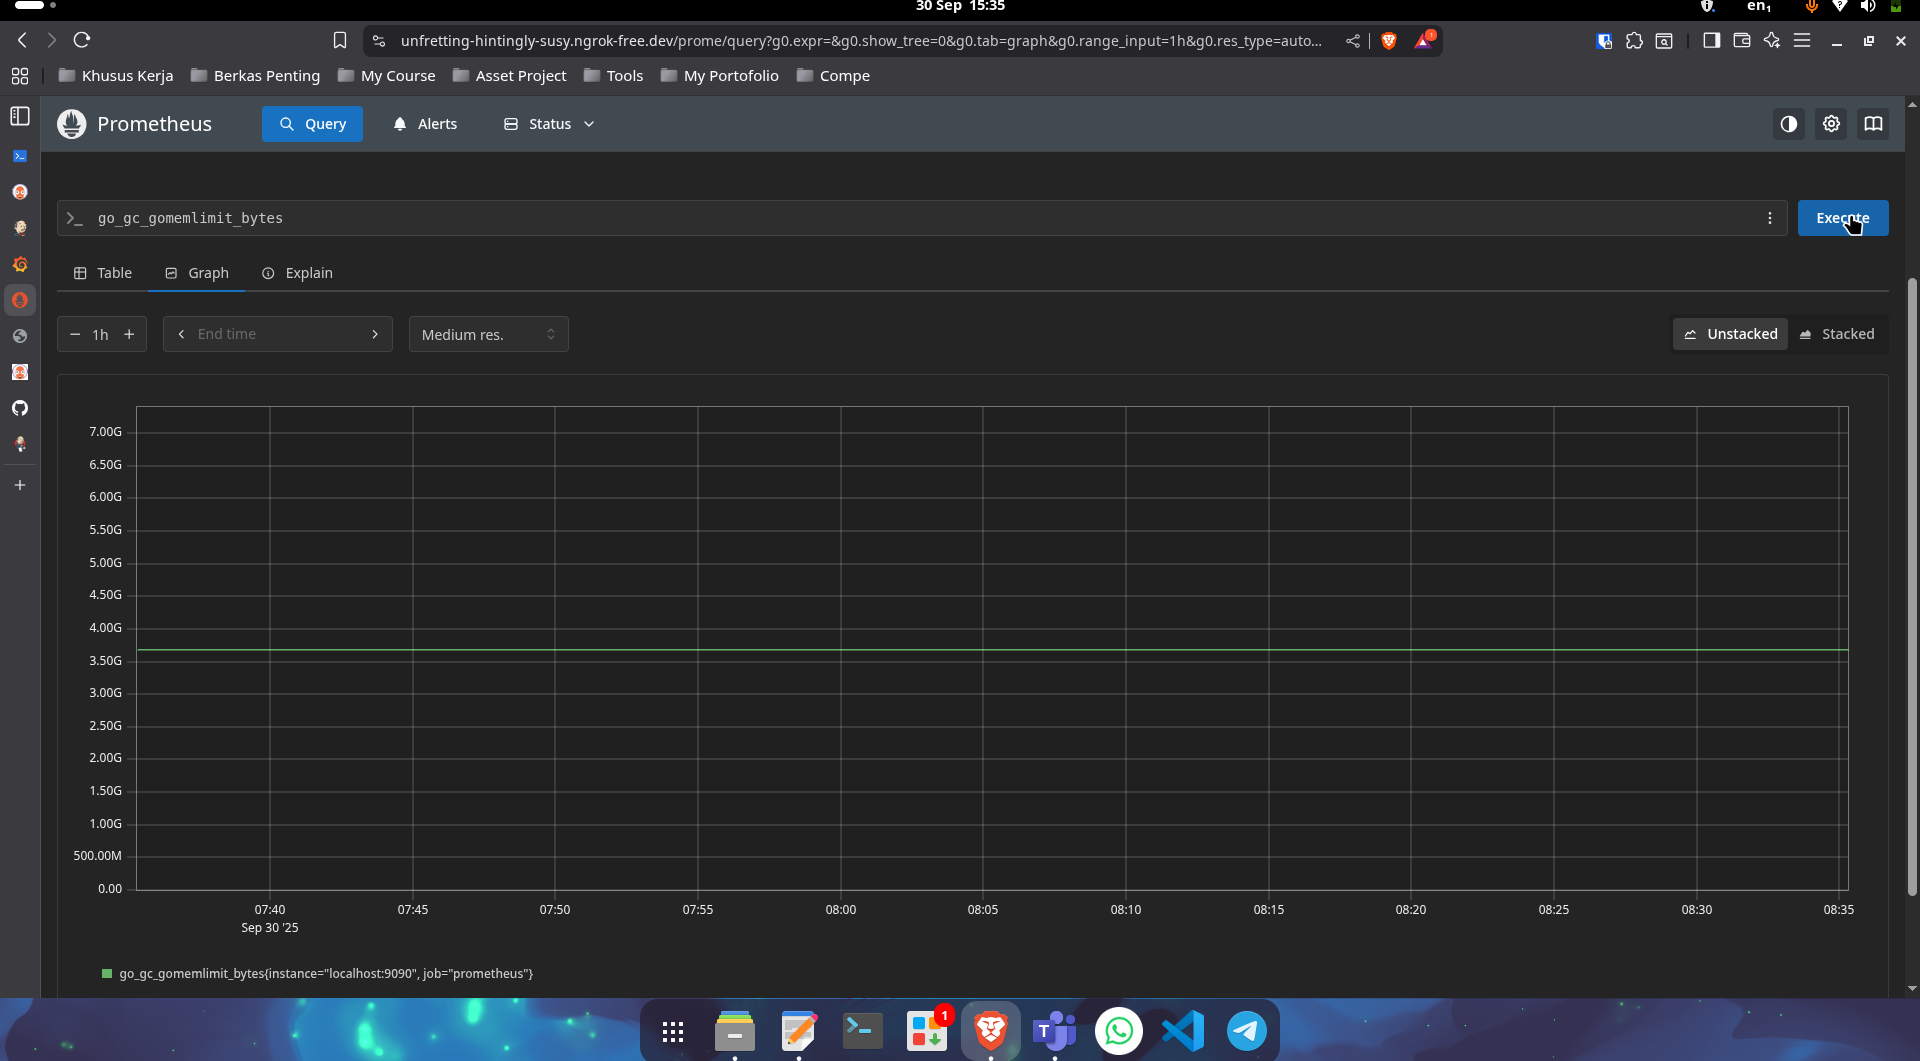
From a laptop browser, validate Prometheus and Grafana at https://{NGROK_URL}/prome and https://{NGROK_URL}/grafana.
Prometheus
Grafana